How to Debug with VS Code Debugger

Debugging is a part of the act of creating beauty with programming languages. It turns one into an investigator seeking out why the work of art did not turn out as expected. One way we all learned at the beginning was to output different values while seeking out the culprit. This article looks at how it is done using the VS code's debugger, javascript as the programming language, and Node.js as the runtime environment.
Prerequisite
I will assume you have Node.Js and VS code editor installed on your system and you can create a REST API. The code used is found in this repo.
Debugger Features
Breakpoints
Breakpoints specify where the running code will break into the debugger. You can create a breakpoint to be absolute or conditional.
Absolute Breakpoints: The debugger stops running the code when it gets to where a breakpoint is specified. It turns on or off by clicking on the editor margin.
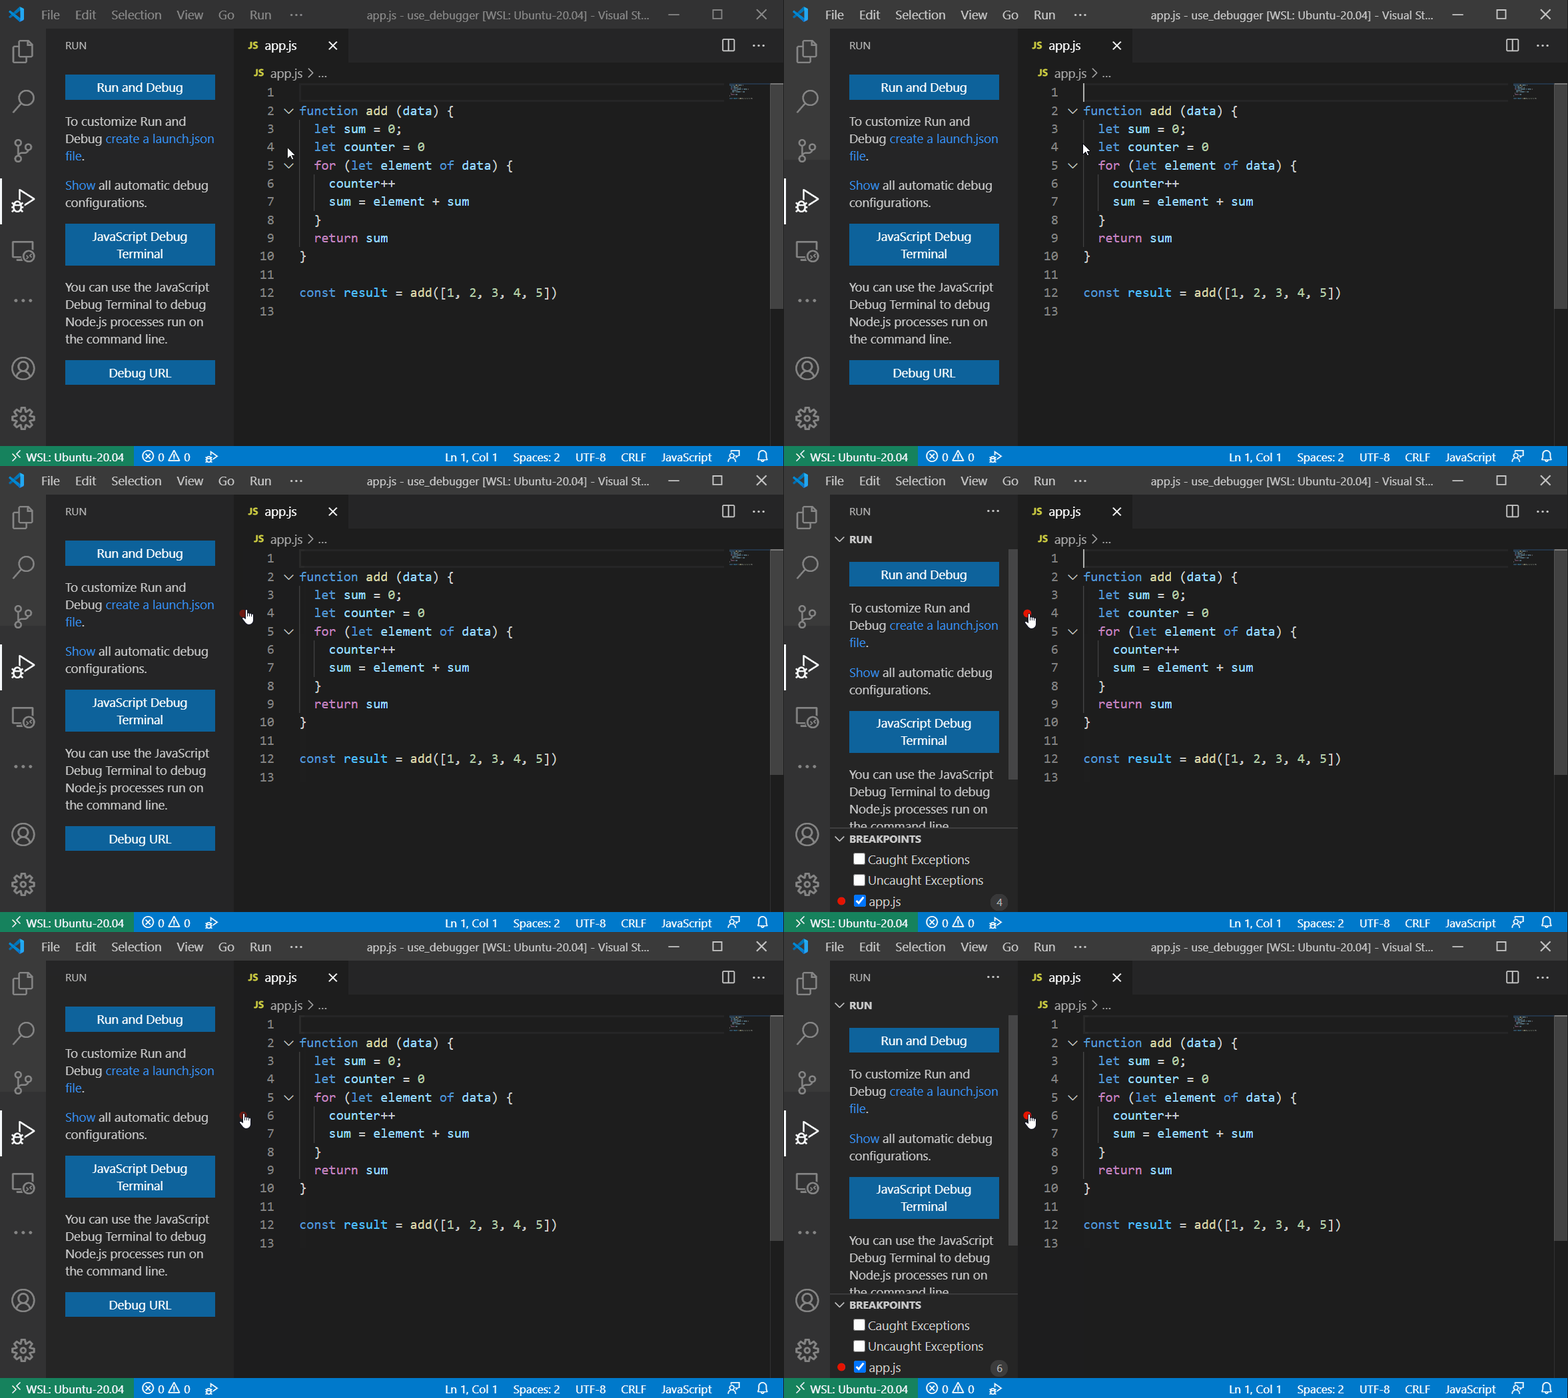
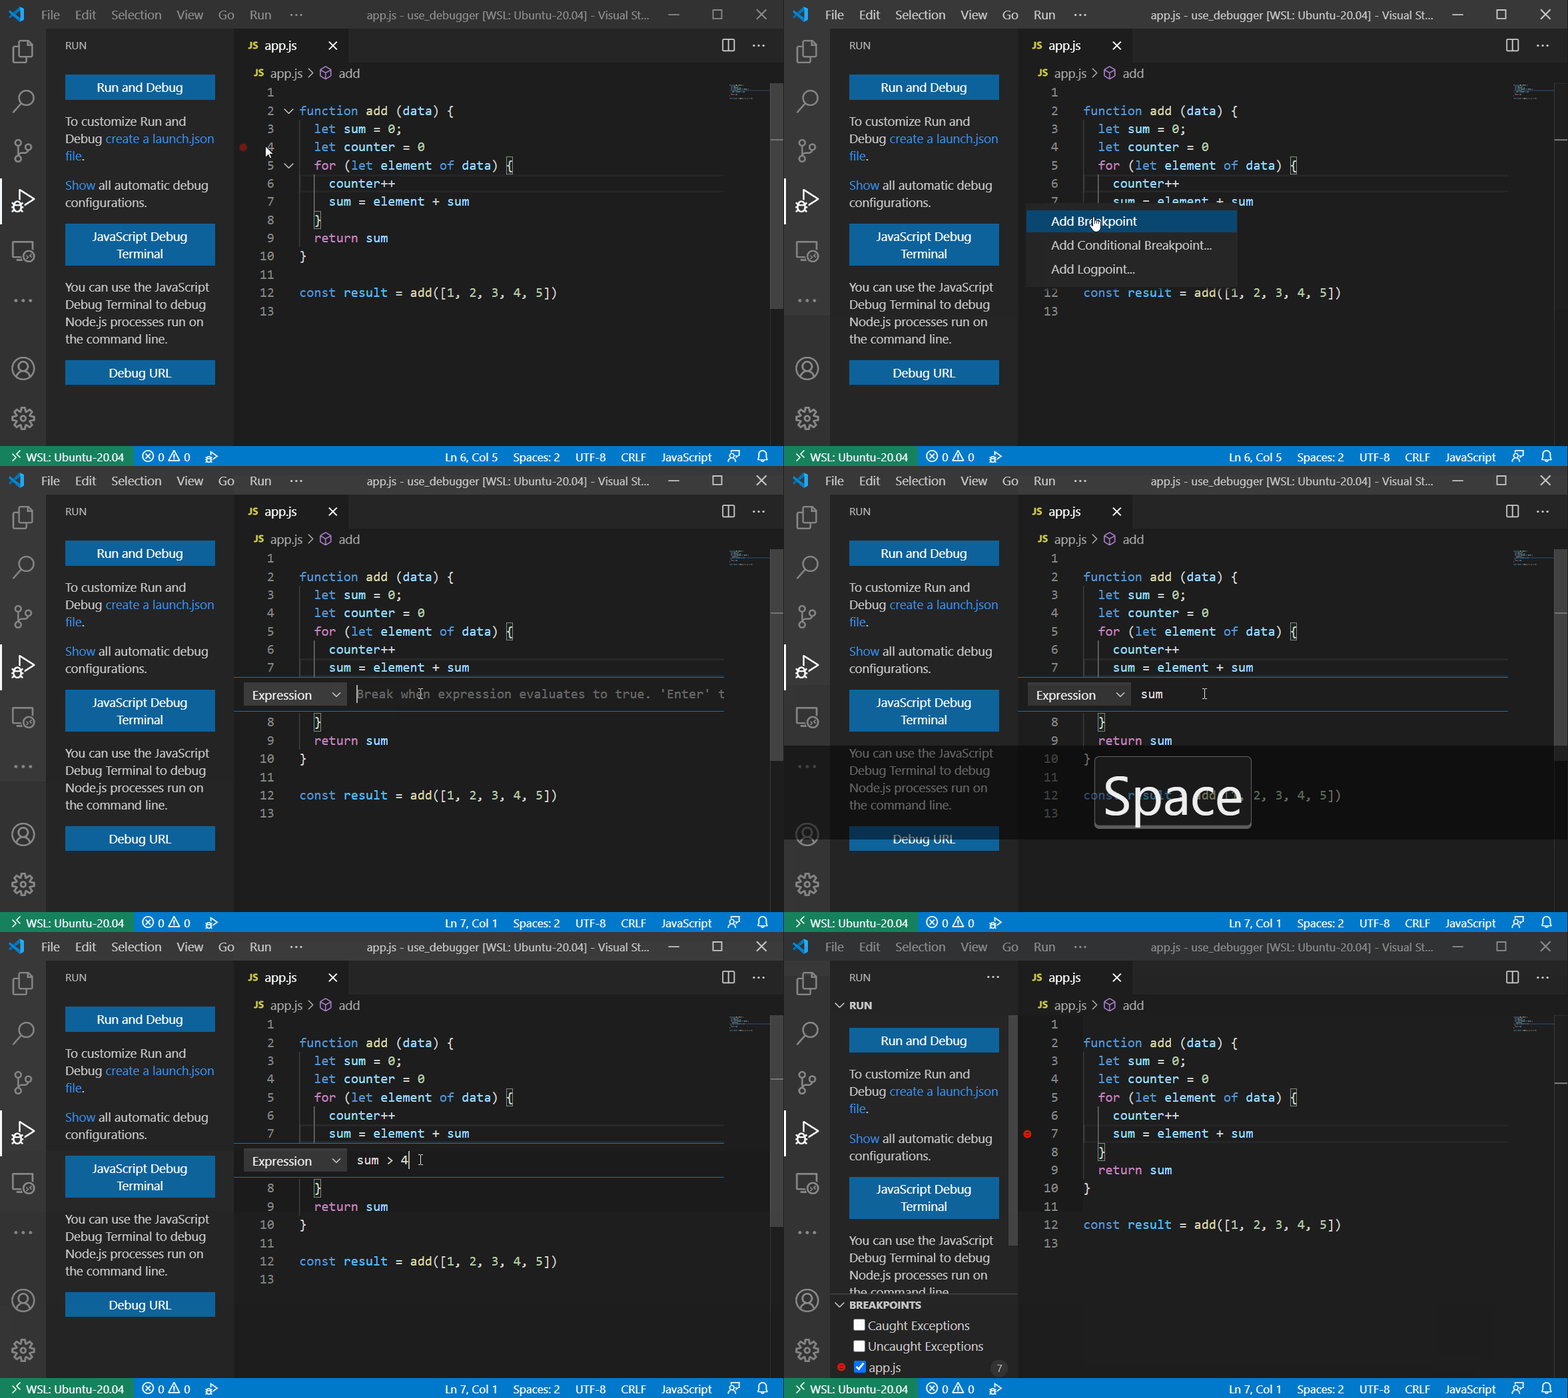
Conditional Breakpoints: Conditional breakpoint signifies that a criterion becomes true before the breakpoint breaks the code execution. To create a conditional breakpoint, you right-click on the editor margin and select the one you want. Two types of conditional breakpoint exist:
Expression: The breakpoint breaks the code when the expression becomes true.
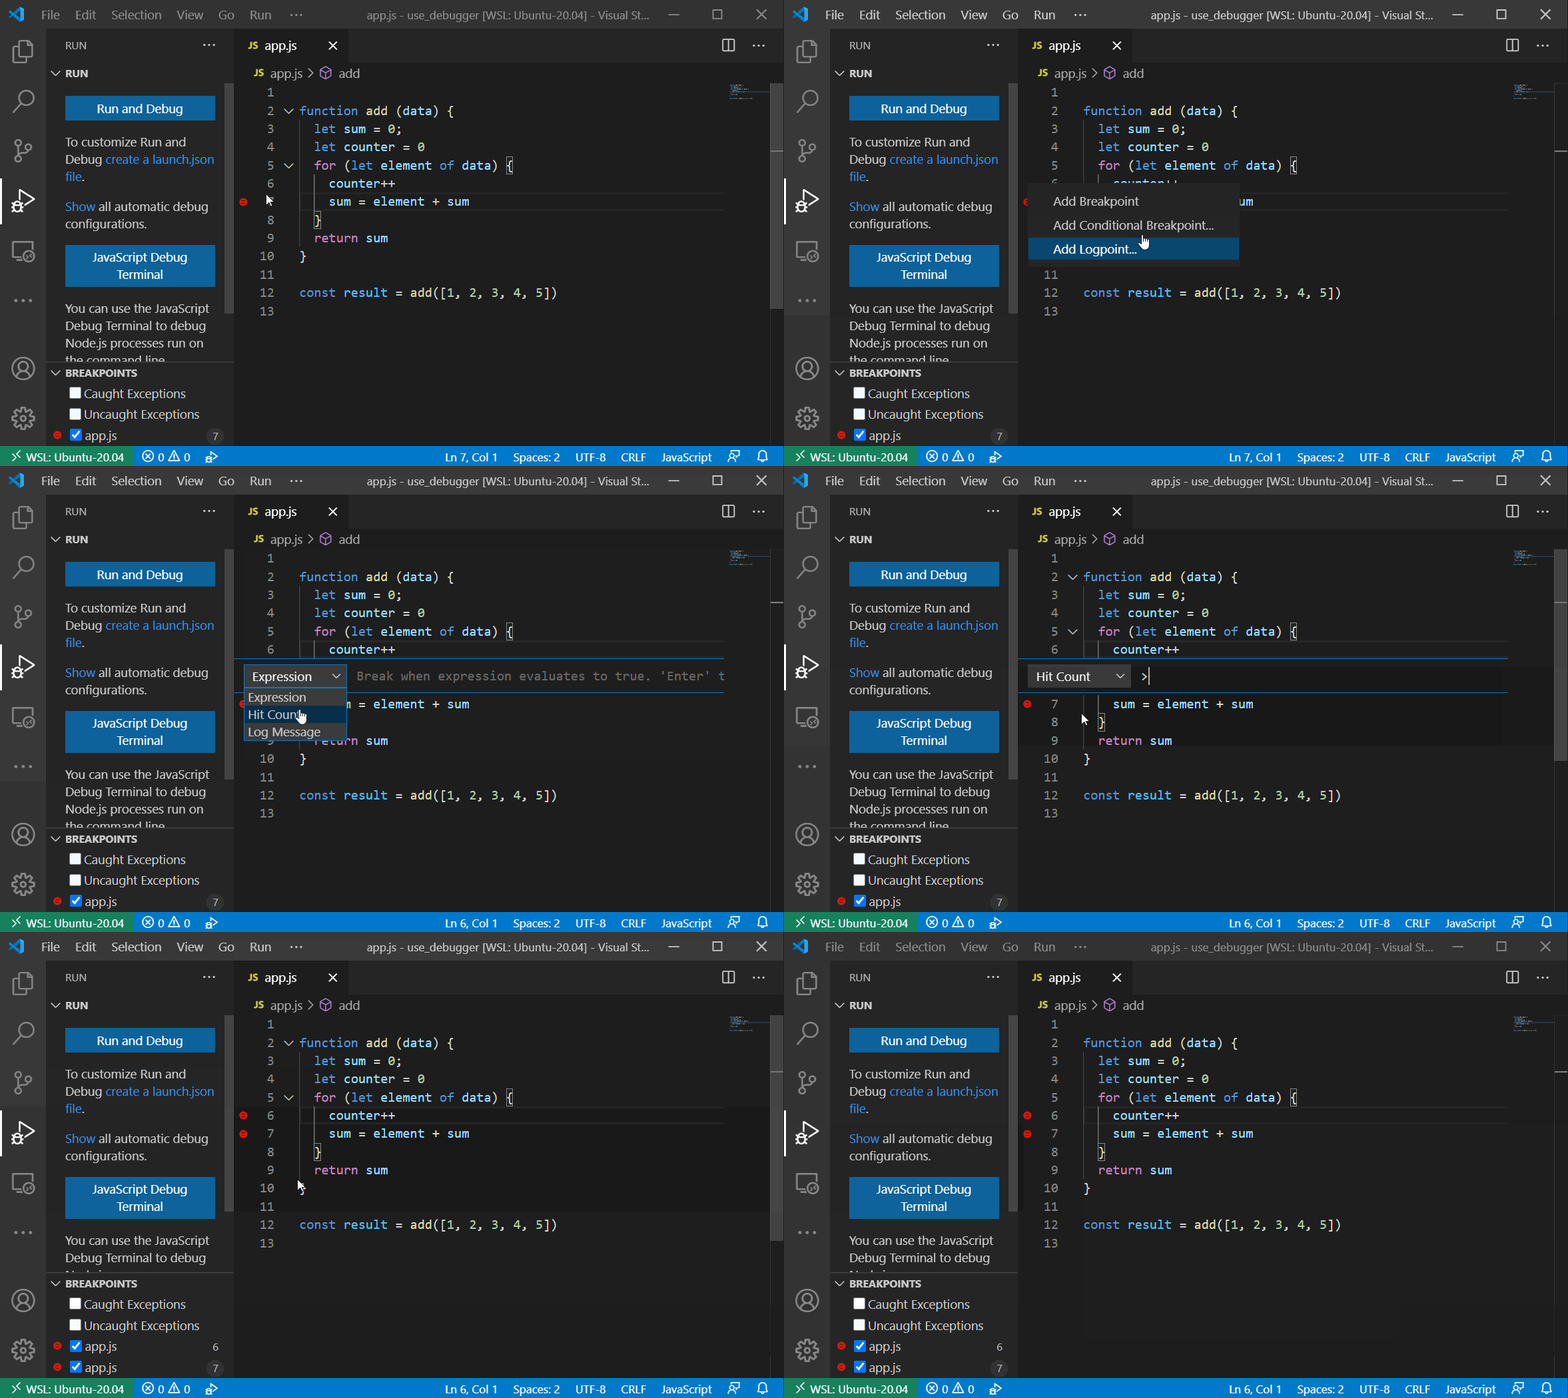
Hit Count: It determines how many times a line of code needs to be hit before the code breaks execution at that line.
Logpoint: Logpoint is a breakpoint which does not break the running code but prints a message. The value in a variable can be displayed by putting the braces in curly braces. A logpoint can be created by right-clicking on the editor margin and selecting logpoint.
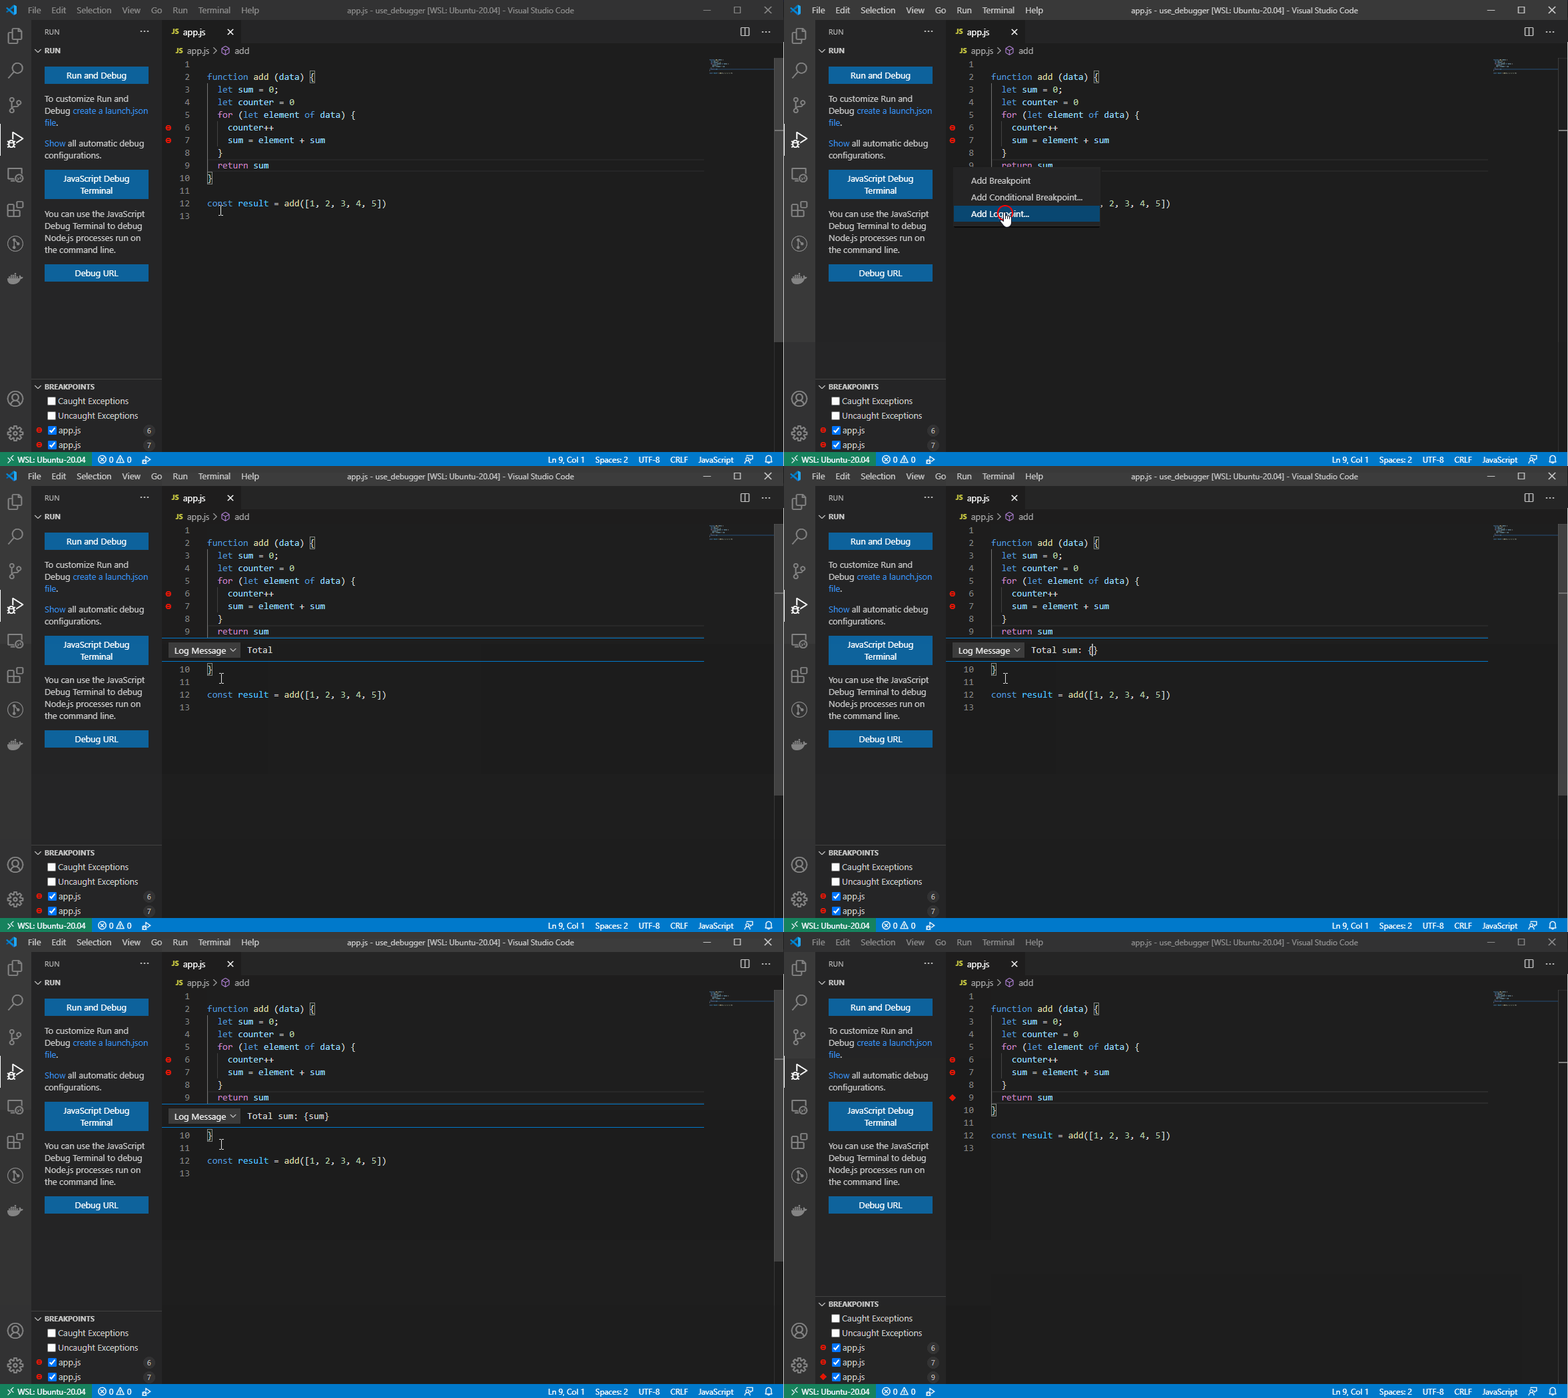
After creating each breakpoint it appears in the BREAKPOINTS section at the bottom of the sidebar.
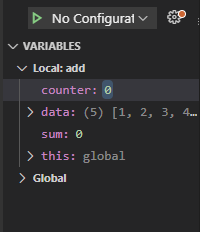
Variables
This section appears at the top sidebar when a debug section is paused by a breakpoint or with the use of the pause icon on the debug toolbar. The variable section allows you to:
- View the value of variables in the code at the point in which the code was paused.
- Change the value of a variable by double-clicking on it, inputting your desired value, and pressing the enter key.
- Add a variable to a watch list.
Watch
This section allows you to focus on the specific variable(s). You choose which variable to focus on by right-clicking on the variable and selecting the "Add to Watch" option.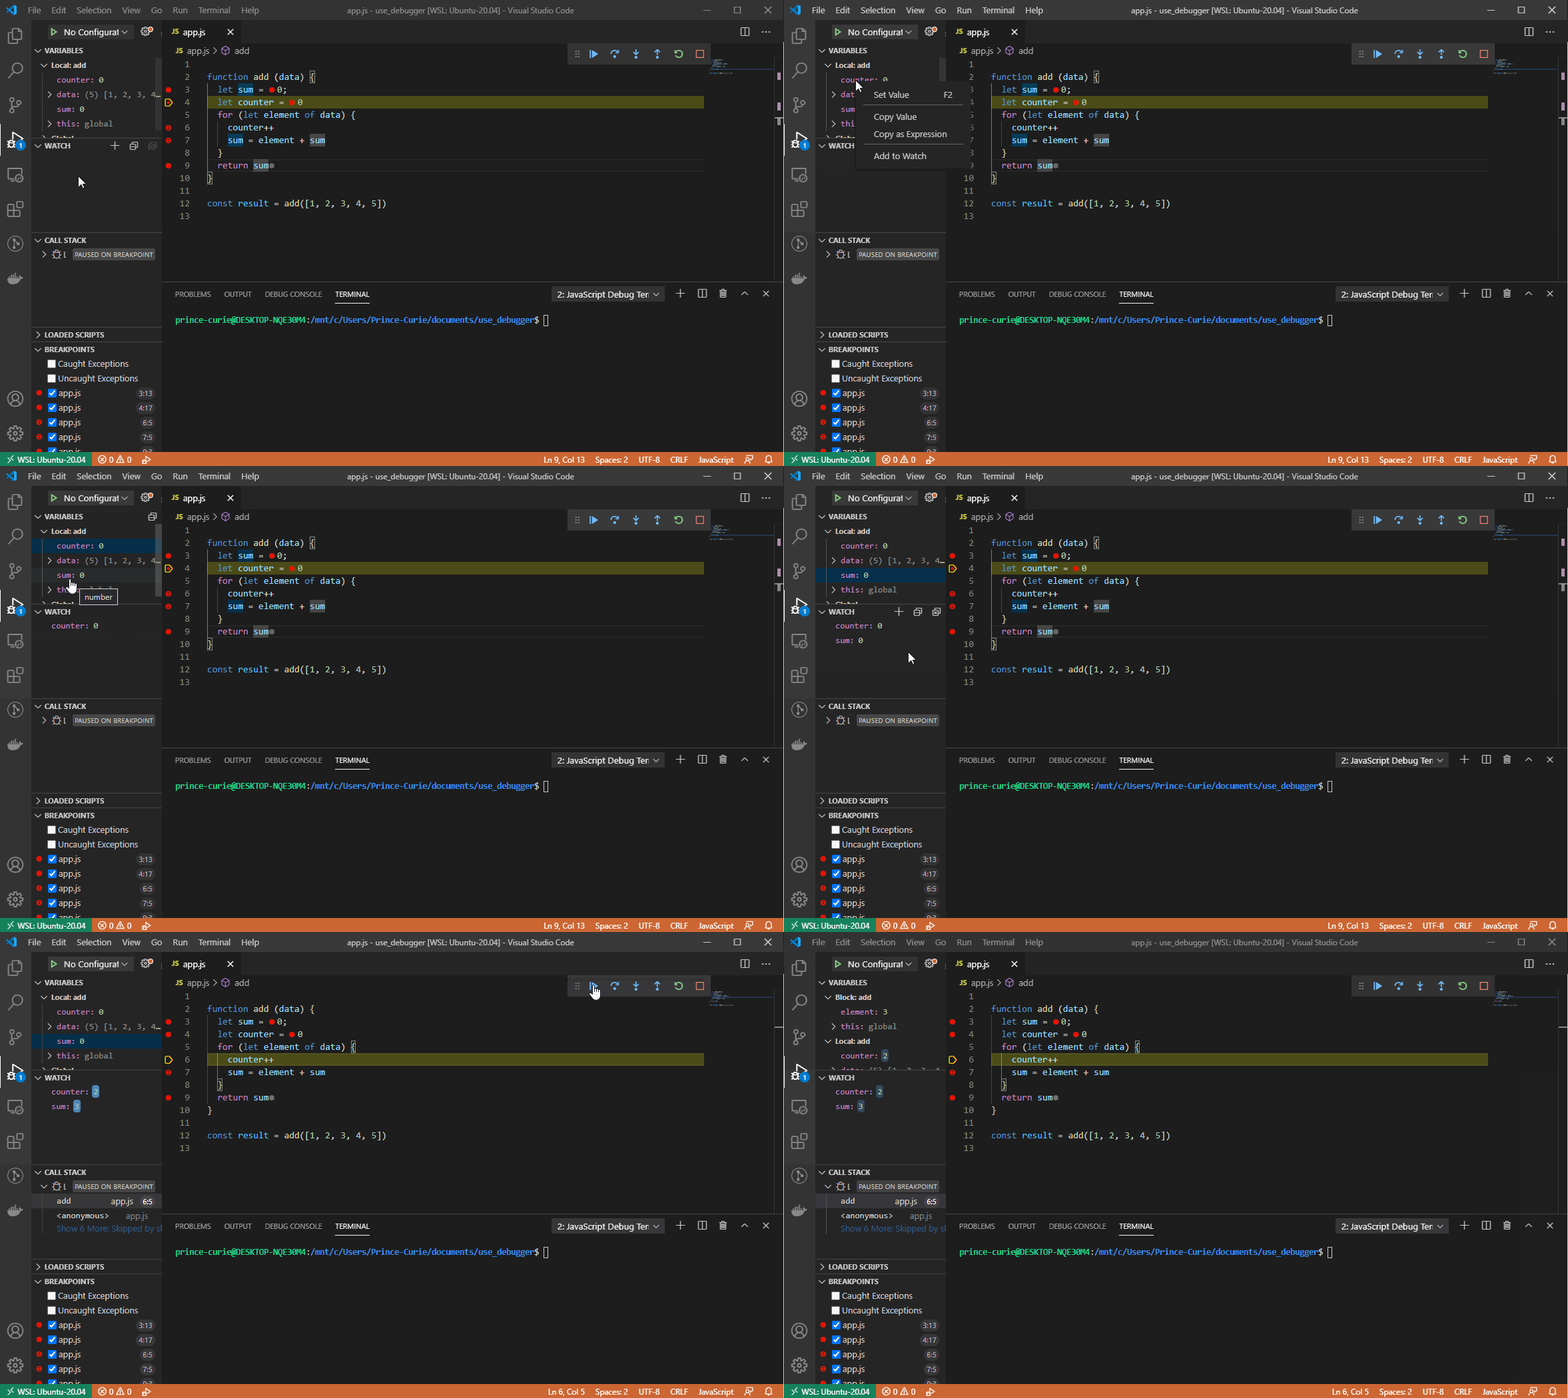
Debug toolbar
 The debug toolbar appears at the top of the editor when a debug section starts.
From left to right each of the icons represents:
The debug toolbar appears at the top of the editor when a debug section starts.
From left to right each of the icons represents:
- Continue / Pause
- Step Over
- Step Into
- Step Out
- Restart
- Stop
Debug console
It displays logged output while debugging a program. This output is logged either with the Node.js console module or VS code's debugger logpoint. To open the debug console, click on view and select Debug Console or use the shortcut Ctrl + Shift + Y.
Debugging a Function
We have a function in a file called app.js which finds the sum of all the numbers in an array.
function add (data) {
  let sum = 0;
  let counter = 0
  for (let element of data) {
    counter++
    sum = element + sum
  }
  return sum
}

const result = add([1, 2, 3, 4, 5])
In other to run the debugger, we have to:
Click on the run icon in the activity bar.
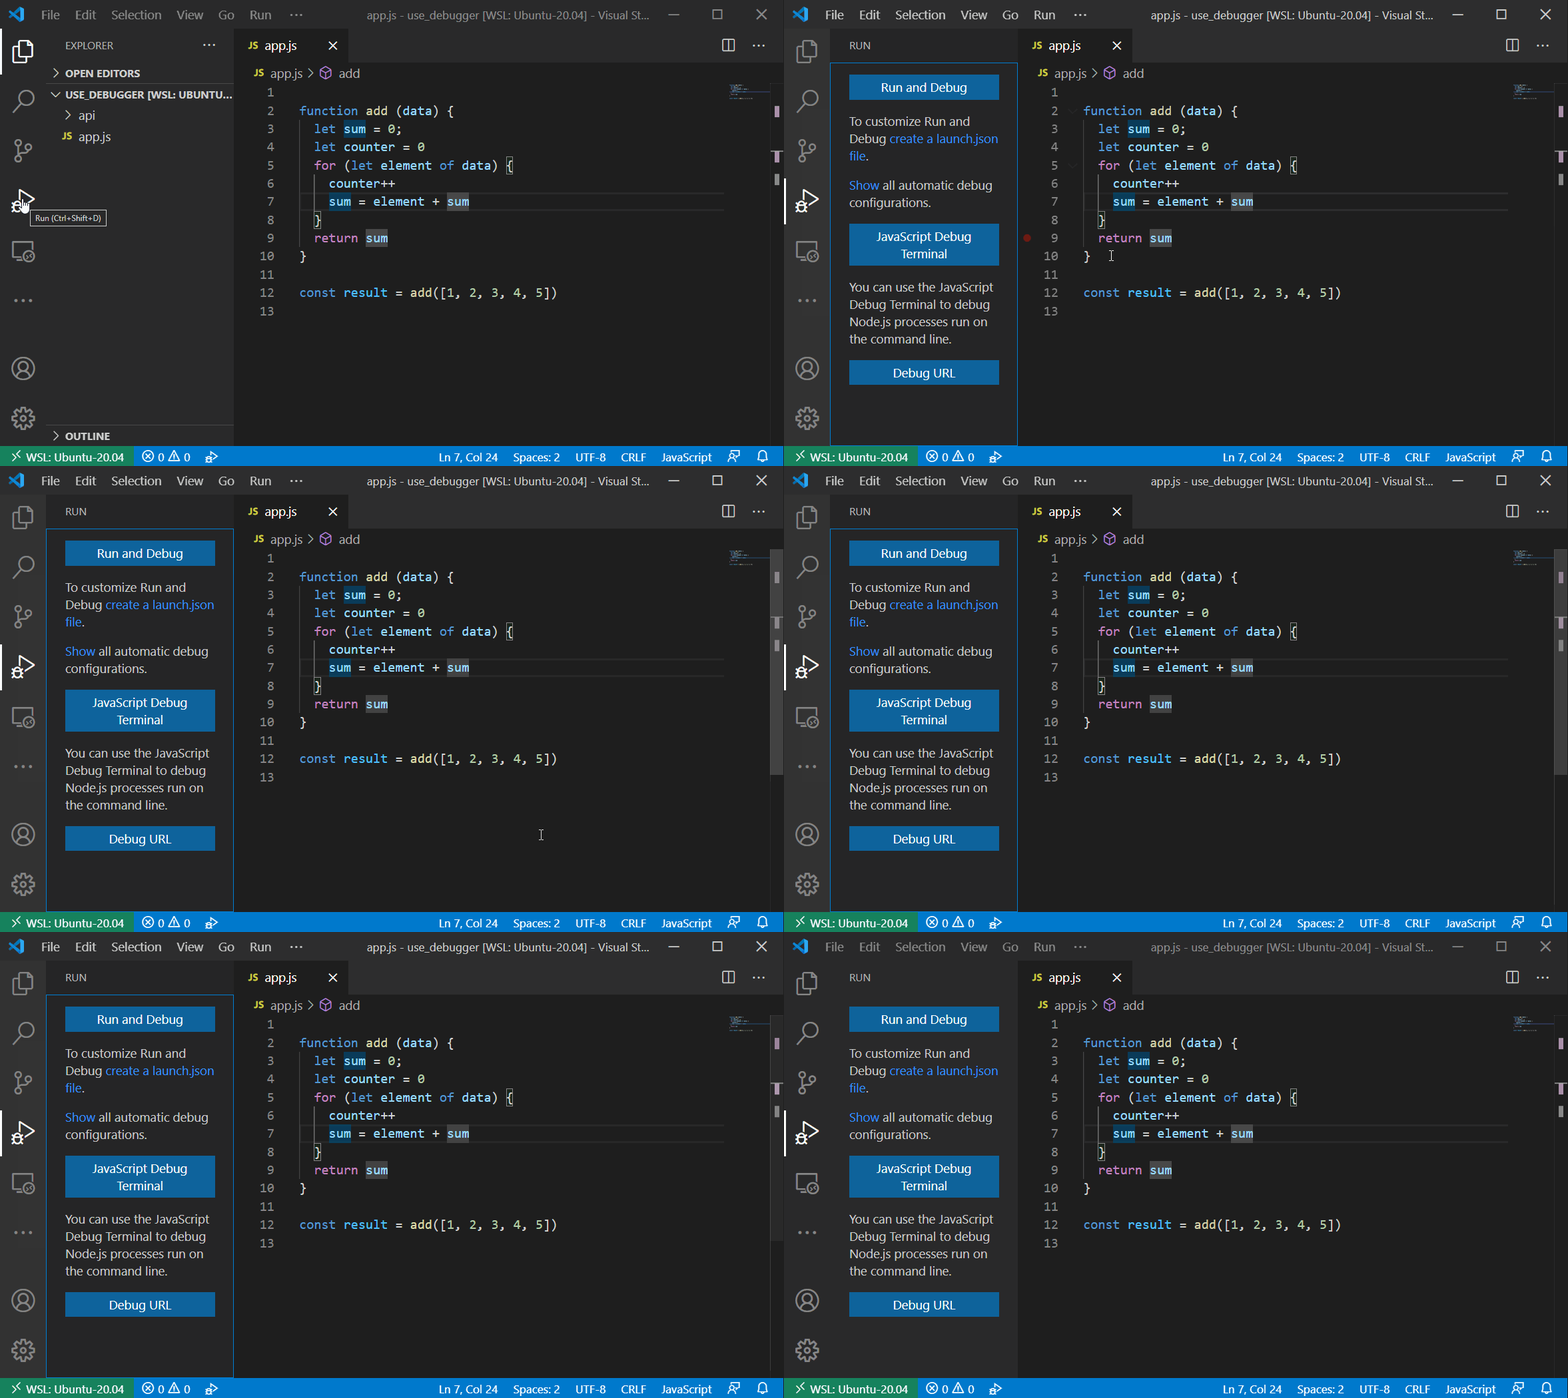 Since no
 launch.jsonfile has been created yet, the run start view is shown as seen aboveClick on the
Run and Debugbutton. A prompt appears asking you to select the environment.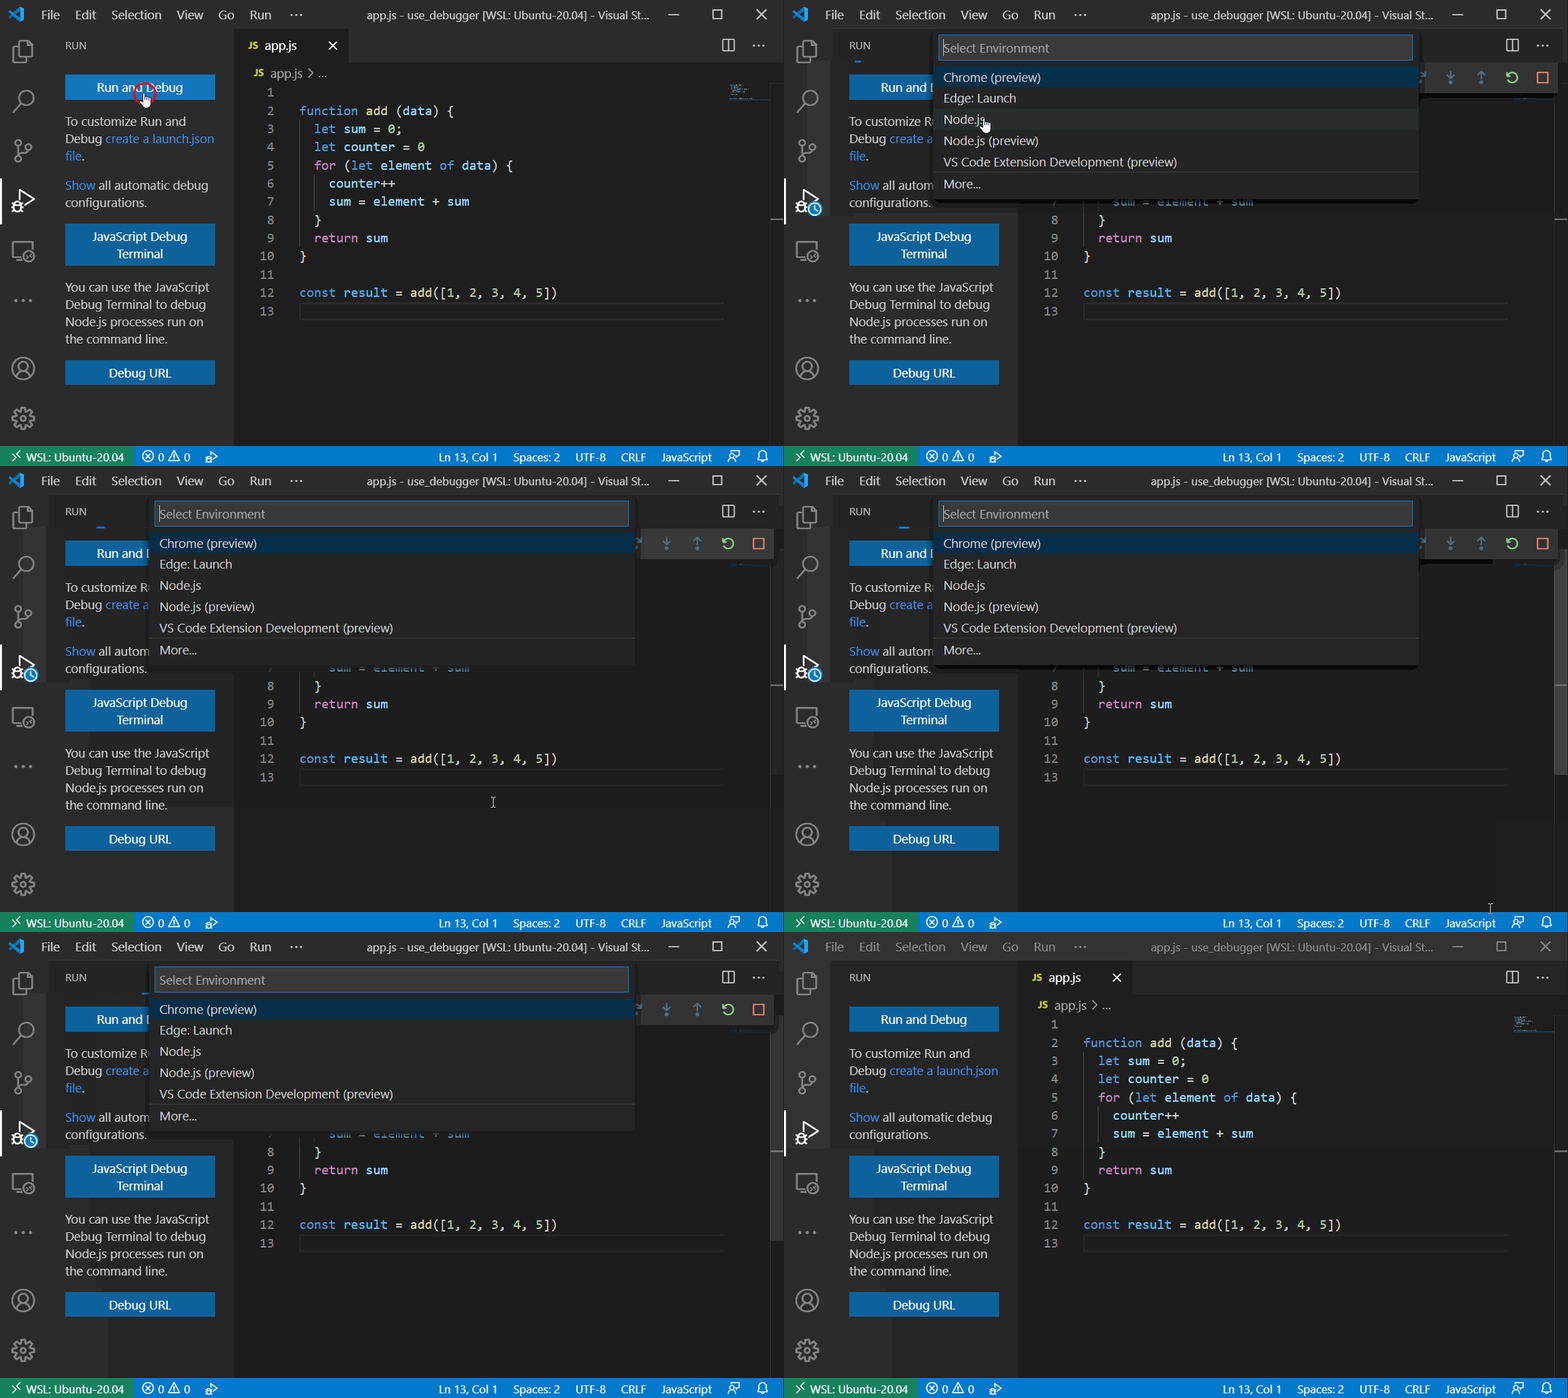
This selection will be made based on where your code is meant to run. Since the function will be running on the
Node.jsenvironment. Node.js will be selected.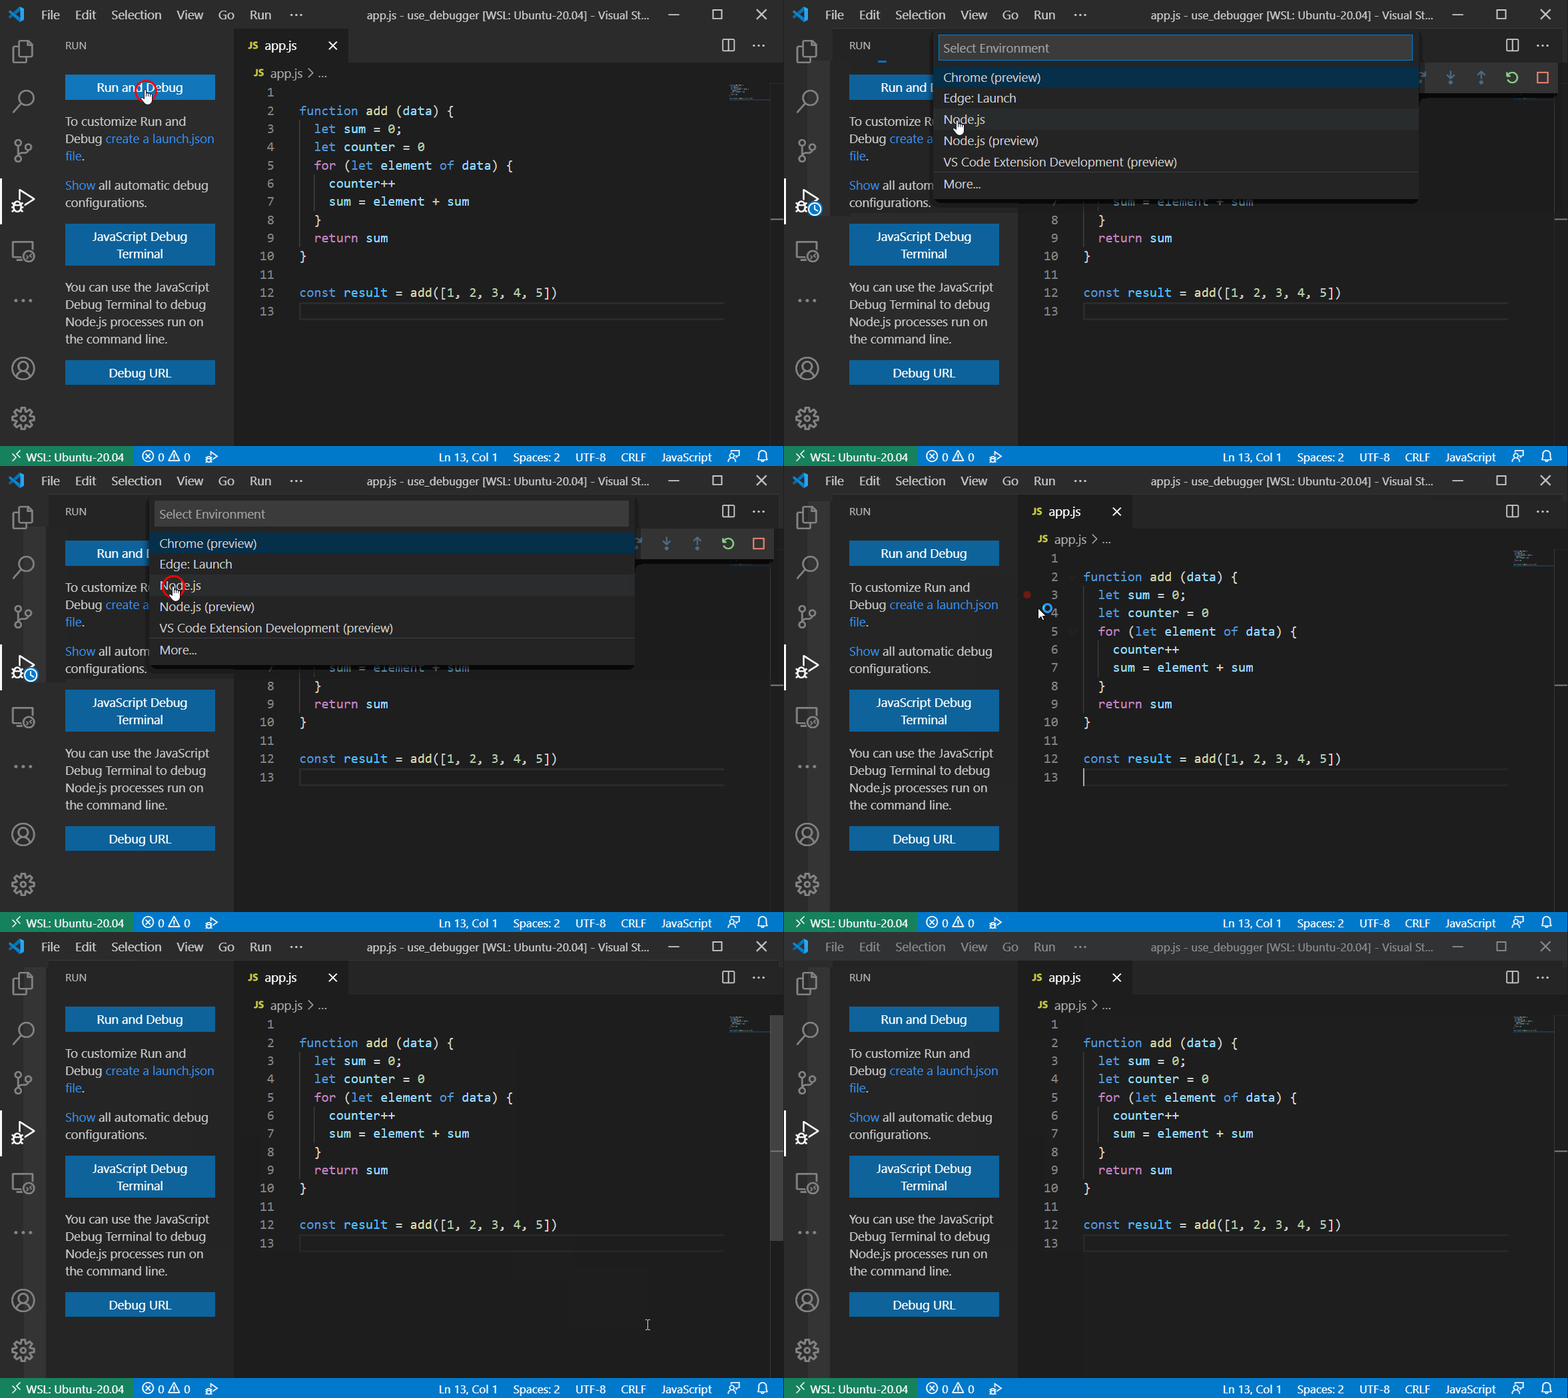
From the image above app.js was run with VS code's debugger. So it begs the question, is that all? No!
The features above show there is more to debugging with VS code's debugger.
Debugging a web API
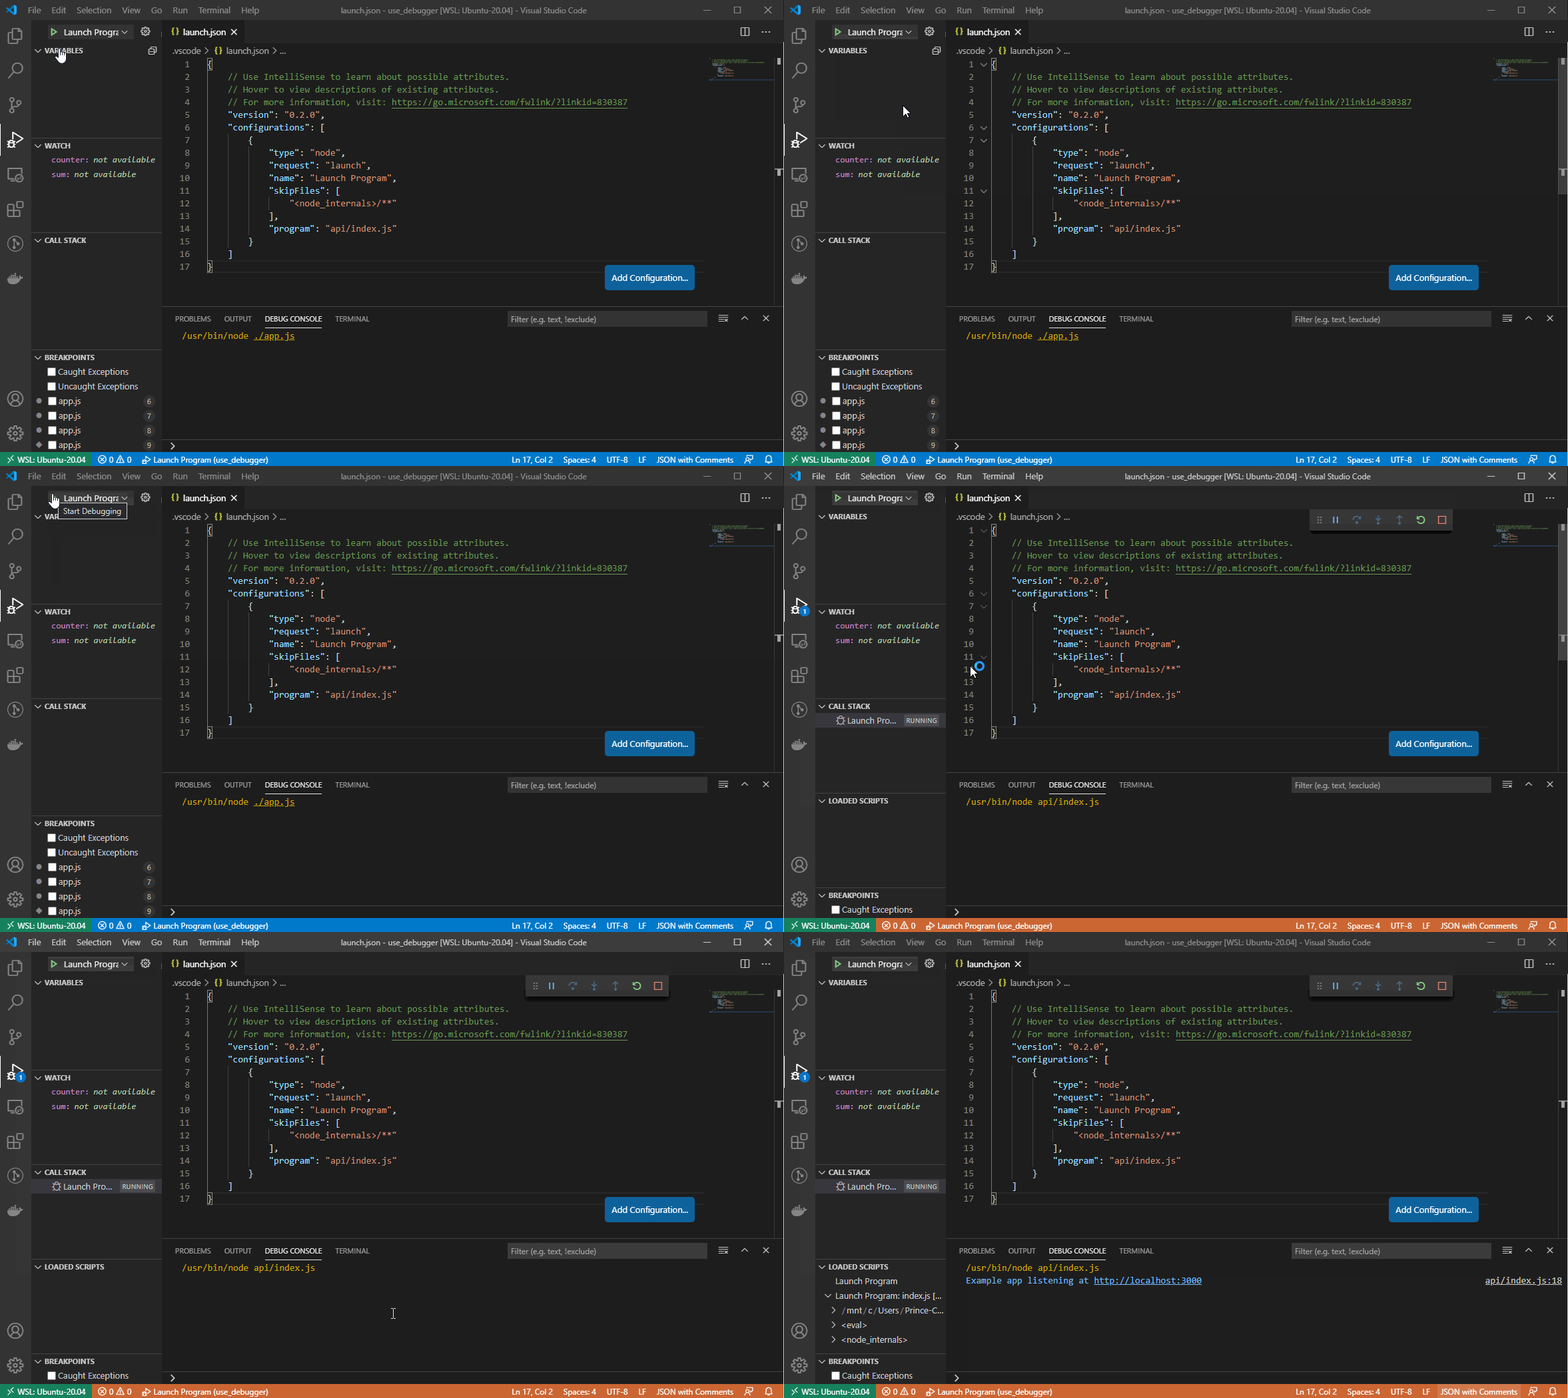
- Create a configuration file: The file allows you to save and configure debugging setup details. The setup is saved in a
launch.jsonfile in a.vscodefolder - Start the debugging process
- Make a request to an endpoint. It is that simple.
Create a configuration file
- Click on the run icon
- Click on "create a launch.json file"
Select "Node.js" as environment: This creates a
launch.jsonfile in a.vscodefolder. The content of the file is:{ // Use IntelliSense to learn about possible attributes. // Hover to view descriptions of existing attributes. // For more information, visit: https://go.microsoft.com/fwlink/?linkid=830387 "version": "0.2.0", "configurations": [ { "type": "node", "request": "launch", "name": "Launch Program", "skipFiles": [ "<node_internals>/**" ], "program": "${file}" } ] }The program value is generated based on what file is open. The value can be edited to point to the file that starts the API server.
{
  // Use IntelliSense to learn about possible attributes.
  // Hover to view descriptions of existing attributes.
  // For more information, visit: https://go.microsoft.com/fwlink/?linkid=830387
  "version": "0.2.0",
  "configurations": [
      {
          "type": "node",
          "request": "launch",
          "name": "Launch Program",
          "skipFiles": [
              "<node_internals>/**"
          ],
          "program": "api/index.js"
      }
  ]
}
Start the debugging process
Click on the Start Debugging icon. It starts up the server and displays whatever message you wrote to ensure the server is running.
Make a request to an endpoint.
You can make a request with any HTTP method using tools like postman etc.
Conclusion
This article has explained the features of VS code debugger. How to set it up for use in debugging a function and also a web API. VS code also has debuggers for other languages and they are found under extensions by searching for debuggers. Will like to hear from you about other ways you have used the VS code's debugger in the comment section below. Thanks.
Comments
Join the discussionNo comments yet. Be the first to comment.

